Most posts on LM Studio’s Load screen treat all 17 settings as equally important. They’re not.
Two of them dominate your experience. Five matter sometimes. The remaining ten are defaults you’ll touch once a year if ever — usually after reading something on Reddit and convincing yourself there’s a free win hiding in the Advanced panel. There almost never is.
This primer is what you want next to you the first time you click Load on a big model and stare at a wall of sliders. Every setting on that screen, in plain terms: what it actually does, what it costs, when to touch it, and how it fights with its neighbors. Platform-agnostic, with explicit callouts where NVIDIA, Apple Silicon, and AMD behave differently — because they really do, and the existing coverage tends to flatten all three into “GPU.”
If you only have eighteen minutes, the cheat sheet below tells you what to do. The rest of the article tells you why.
The cheat sheet
Every setting on the Load screen, ranked by cluster, with my opinionated default and the failure mode if you set it wrong. I’d save a screenshot of this on first read.
| Setting | Default I’d ship | Touch it when… | Cost of getting it wrong |
|---|---|---|---|
| Context Length | 8K–32K, well under model max | You genuinely need long context | Linear VRAM growth; OOM or sub-1 tok/s |
| GPU Offload | Max layers that fit | OOM at load; sharing the GPU | Below max = slow on dGPU; cosmetic on Apple |
| Offload KV Cache to GPU | ON | VRAM tight and you’ll trade speed for fit | Per-token PCIe traffic if off |
| Unified KV Cache | ON | Never; the default is right | Negligible perf delta either way |
| Flash Attention | ON | Never; it’s the gate to KV quant | No K/V quantization without it |
| K Cache Quantization | Q8_0 | Long context + tight VRAM | Below Q8: attention quality drops sharply |
| V Cache Quantization | OFF | You’re desperate for VRAM | Q4 V tanks structured output |
| CPU Thread Pool Size | Physical cores − 1 | Sharing the box with other compute | Too many threads = scheduling overhead |
| Evaluation Batch Size | 512 | Ingesting very long prompts on a big GPU | Wasted scratch VRAM if too high |
| Max Concurrent Predictions | 1 | Serving multiple consumers | KV cache multiplies linearly |
| Keep Model in Memory | ON | RAM is tight or you switch models often | Off = full re-load on every chat |
| Try mmap() | ON (RAM-comfortable); OFF (tight) | You see periodic generation stalls | Stalls under pressure, slower cold start if off |
| Seed | Random | Eval runs, bug repros | Fixed seed in chat = boring repetition |
| Number of Experts | Model’s trained value | Don’t | Lower = faster but dumber |
| Force MoE Experts to CPU | 0 (fits in VRAM); raise as needed | A MoE model won’t load | High = much slower, but it runs |
| RoPE Frequency Base | Auto | Extending past trained context | Manual on a model that doesn’t need it = worse output |
| RoPE Frequency Scale | Auto | Same | Same |
Four common starting points, ranked by hardware shape. Pick the one closest to yours and tune from there:
24 GB dGPU · single user
- Context Length
- 16384
- GPU Offload
- max
- Offload KV Cache
- ON
- Flash Attention
- ON
- K Cache Quant
- Q8_0
- V Cache Quant
- OFF
- Max Concurrent
- 1
- mmap · Keep-in-Memory
- ON · ON
The mid-range default. 24–32B dense or a small MoE that fits whole on the GPU.
64 GB Apple Silicon
- Context Length
- 32768
- GPU Offload
- max (cosmetic)
- Flash Attention
- ON
- K Cache Quant
- Q8_0
- V Cache Quant
- OFF
- CPU Threads
- P-core count
- Max Concurrent
- 1
- mmap · Keep-in-Memory
- ON · ON
Unified memory: most knobs are no-ops. CPU threads matter; mmap matters under pressure.
8 GB dGPU · tight VRAM
- Context Length
- 8192
- GPU Offload
- max (auto)
- Flash Attention
- ON
- K Cache Quant
- Q8_0
- V Cache Quant
- OFF
- Eval Batch Size
- 256
- Max Concurrent
- 1
- mmap · Keep-in-Memory
- OFF · ON
Aggressive quant; pull every cheap lever before sacrificing GPU layers.
70B MoE on 24 GB
- Context Length
- 8192
- GPU Offload
- max (auto)
- Flash Attention
- ON
- K Cache Quant
- Q8_0
- V Cache Quant
- OFF
- Force MoE → CPU
- raise until loads
- Number of Experts
- trained value
- mmap · Keep-in-Memory
- ON · ON
Force MoE experts to CPU until it loads. Expect 5–10 tok/s, not dGPU speeds.
Everything else: leave alone until you have a specific reason. Below, for each setting, here’s why.
The two that always matter: Context Length and GPU Offload
These are the only two you should expect to touch on every new model. They dominate the memory budget and they’re the only two where the default LM Studio shows you is sometimes wrong on purpose.
Context Length
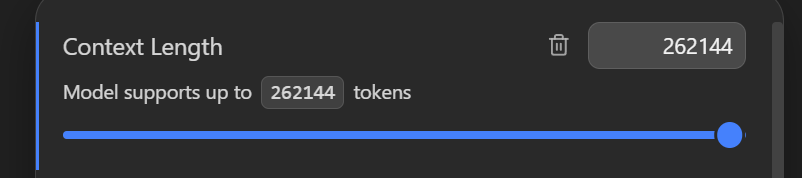
The slider shows the runtime context window in tokens, capped at the model’s trained maximum (the screenshot above shows a model trained for 262,144 tokens). LM Studio defaults to a fraction of that on load, and people instinctively crank it to the max. Don’t.
The KV cache scales linearly with context length.
The default I’d ship for most chats: 8K to 32K. Most prompts, most coding tasks, most agent loops fit comfortably in 16K. Push higher only when you have a specific use case — a long document to summarize, a large file to refactor, a multi-turn conversation that genuinely accumulates.
The rule: pick the smallest context length that holds your actual prompts. You can always reload at a higher value when the task demands it.
GPU Offload
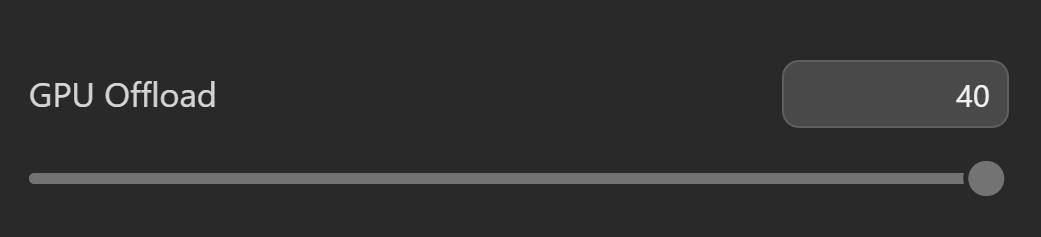
This is a layer count, not a percentage. The max equals the model’s total transformer layer count plus a couple of bookkeeping layers; setting it to max puts the whole model on the GPU. The screenshot shows GPU Offload at 40 — meaning 40 of the model’s layers run on GPU, the rest on CPU.
Every layer that lives on CPU adds a CPU↔GPU transfer to every forward pass. Tokens/sec collapses fast once you’re below “most layers.”
The good news: LM Studio’s auto-detect on first load is usually within 1–2 layers of optimal, and it accounts for the rest of the budget (weights + KV cache + scratch buffers). When it picks 40 of 80, that’s because 41 wouldn’t fit.
The only time worth manually touching GPU Offload after auto-detect: when you’re sharing the GPU with another process — a Stable Diffusion run, a game in the background, another CUDA workload. Pull layers back manually to free VRAM for the other tenant.
The KV cache family (where most VRAM goes after weights)
This cluster is where the article earns its slot. Five settings — Offload KV Cache to GPU Memory, Unified KV Cache, Flash Attention, K Cache Quantization Type, V Cache Quantization Type — all govern the runtime cache that holds your conversation’s intermediate state. Together they’re often the second-largest VRAM consumer after the model weights themselves, and they interact in ways that are not obvious from the labels.
Offload KV Cache to GPU Memory
Should the KV cache live in VRAM or in system RAM? The default — ON — puts it in VRAM, where the attention kernels can read it without a PCIe round trip. Turning it OFF moves the cache to host RAM, which frees VRAM for more model layers but forces the GPU to fetch K and V tensors over PCIe on every token.
That tradeoff sounds even-handed. It isn’t. PCIe bandwidth is a small fraction of VRAM bandwidth, and attention is bandwidth-bound. Turning this off typically cuts tokens/sec by half or worse, and the freed VRAM rarely lets you offload enough additional layers to make it back.
Leave this ON. The only case where OFF is right: you’ve got a model that nearly fits in VRAM, the KV cache is the one thing pushing you over, and you’d rather have all layers on GPU at half the token rate than fewer layers on GPU at full rate. That’s a real situation, but it’s narrow. Try quantizing the KV cache first (below); it’s usually the better lever.
Unified KV Cache (Experimental)
“Unified” in llama.cpp’s vocabulary means a single contiguous KV cache buffer shared across all sequences in the batch, rather than per-sequence buffers managed independently. It does not mean K and V are merged (they’re still separate tensors), and it does not mean cache reuse across requests.
The practical win is memory layout efficiency for batched and concurrent inference — relevant if you’ve bumped Max Concurrent Predictions above 1. For single-stream chat at concurrency 1, the perf difference is in the noise. The flag is marked Experimental because the upstream implementation is still stabilizing, not because it’s risky.
Leave it on. Zero observable cost for single-stream use, mild improvement for parallel decode. The default is right.
Flash Attention
The single most important toggle in this cluster, and the one that gates the rest. Flash Attention is a fused attention kernel that streams Q, K, and V through SRAM in blocks instead of materializing the full attention matrix. The result: lower memory footprint, faster generation, and — critically — it’s the only attention codepath in llama.cpp’s 2026 implementation that supports K/V cache quantization.
This means: if you want quantized KV cache, Flash Attention must be on. Not “on most backends” — universally, across CUDA, Metal, and ROCm. The quantization kernels live in the FA path. Turn FA off and the K/V quantization dropdowns become decorative.
The good news: Flash Attention is a pure win on every backend that supports it in 2026. There is no scenario in current LM Studio where you should turn it off. The toggle exists for legacy compatibility with old hardware (pre-Ampere NVIDIA, some early ROCm targets) that doesn’t have the kernel implementation. If your hardware supports it, the toggle defaults to on. If it doesn’t, you’ll know — load times will tell you.
K Cache Quantization Type (Experimental)
Quantize the K side of the KV cache to save VRAM. The dropdown offers Q8_0, Q4_0, Q4_1, and a few others. The default (Q8_0, near-lossless 8-bit) is the right call for most workloads. The real question is whether to go lower.
This is why LM Studio defaults K to Q8_0 and gates V behind a separate checkbox: K is much more sensitive than V. Q8_0 K cache is a near-free 2x memory win on the cache. Q4_0 K cache is risky and tends to show up first as “the model started doing weird off-by-one things in long conversations.”
My default: Q8_0 always. Q4 K only when you’ve got a hard VRAM constraint, a long context you can’t shorten, and you’ve actually tested model output on your workload to confirm it survived.
V Cache Quantization Type (Experimental)
Same idea, V side. LM Studio gates this behind a checkbox (you have to opt in to enable the dropdown) precisely because the user-visible quality impact is more obvious than for K — even though V is “less sensitive” in the analytic sense above.
The contradiction resolves like this: K errors degrade attention scores subtly and across the board, in ways you only notice on hard tasks. V errors hit the actual output values directly, so they show up as visible artifacts — repeated tokens, off-by-one structure in JSON output, malformed code blocks. The model still works, but it works worse in ways you can see.
My default: leave V quantization OFF. The VRAM savings of Q4 V are real (cuts the V half of the cache to 25%), but the quality cost shows up first in structured output — exactly the workloads people use local models for. Only enable when you’ve measured the savings on your hardware and your model genuinely doesn’t fit otherwise.
If you do enable it, Q8_0 V is generally safe. Q4 V on a coding model: avoid.
Host-side knobs: CPU, memory, parallelism
This cluster covers settings that govern how LM Studio uses the host machine — outside the GPU. Most readers leave all five at their defaults, and they’re right to. I’ll keep this section tight.
CPU Thread Pool Size
Threads dedicated to CPU-side inference work (the layers that didn’t get GPU offload, plus tokenizer and sampler work). The default is usually right — LM Studio reads your physical core count and sets the pool to that minus one or two.
Two things to know:
-
More threads is not always better. Token generation is memory-bandwidth-bound, not compute-bound. Past your physical core count, hyperthreaded “logical” threads compete for the same memory channels and add scheduling overhead without adding throughput. Sometimes they make things slower.
-
The sweet spot is physical cores minus one or two, leaving headroom for the OS and the GPU driver.
Evaluation Batch Size
This is the prompt processing batch size — llama.cpp’s n_batch. It’s how many tokens are processed in parallel during the prefill phase (when the model ingests your prompt), not during generation. Higher values prefill long prompts faster but require more scratch VRAM.
Default 512 is fine for almost everyone. Bump to 1024 or 2048 only if you’re regularly ingesting very long prompts (50K+ tokens) on a GPU with VRAM headroom to spare. Token generation speed isn’t affected — this only changes how long you wait for the first token to appear when the prompt is long.
Max Concurrent Predictions (Experimental)
The number of independent generations the model can produce in parallel from this one loaded instance. Default 1; each additional slot needs its own KV cache.
The cost is roughly linear: 2 concurrent predictions ≈ 2x KV cache memory, 4 concurrent ≈ 4x. For a 32K context model with 4GB KV cache at concurrency 1, going to 4 means 16GB of cache, full stop. The compute side has minor batching efficiency wins, but the memory cost dominates.
Leave at 1 unless you’re serving the local server to multiple consumers — for example, your editor plugin, a chat UI, and a background script all hitting LM Studio’s HTTP API simultaneously. Even then, 2 is almost always enough. Above 2 is rare in single-user setups; the memory cost outpaces the throughput win quickly.
Keep Model in Memory
When on, the model’s weights stay resident after the last request. When off, the runtime can unload under memory pressure. Default: on.
The only reason to turn this off is if you’re switching models often and want LM Studio to free RAM between switches. For a single-model workflow, leave it on — the cost of reloading a 30GB model from disk on every chat is grim.
Try mmap()
Memory-map the GGUF file into the process’s address space, so pages load lazily from disk as the model accesses them. Wins: near-instant cold start, shared page cache across processes, unused weights never occupy RAM. Loss: pages can be evicted under memory pressure and refaulted on next access, producing periodic generation stalls.
The interaction with Keep Model in Memory is subtle and worth getting right: mmap on + Keep-in-Memory on does NOT pin the model. Pinning — actually locking the bytes in RAM so the OS can’t reclaim them — requires Keep-in-Memory on and mmap off, which switches to standard malloc allocation that locks the pages.
On a system with comfortable RAM headroom: mmap on, Keep-in-Memory on. Fast cold start, no eviction in practice.
On a system running close to RAM capacity: mmap off, Keep-in-Memory on. You’ll pay a slower first load, but generation won’t stall when something else (Chrome, the OS, a build) takes memory pressure to the limit.
Symptom of getting this wrong on a tight system: generation runs fine for a while, then pauses for 200–800ms, then resumes. That’s a re-fault. Turn mmap off.
MoE-only: experts count and CPU offload
These two only apply to Mixture-of-Experts models — Mixtral, Qwen3-MoE, DeepSeek V2/V3, the recent open-weight Llama 4 family. If you’re running a dense model (Llama 3 70B, Qwen 2.5 32B), ignore both sliders.
Number of Experts

The number of active experts per token. Every MoE architecture has a trained value: Mixtral 8x7B activates 2 of 8 experts per token; Qwen3-235B activates 8 of 128. The model was trained at that value, and that’s where its quality lives.
The slider lets you change it, and the temptation is to lower it for speed or raise it for quality. Don’t. Lowering active-expert count makes generation faster but the model gets noticeably worse — you’re asking it to route through fewer experts than it was trained to use. Raising above the trained value rarely helps because the routing network was never trained to use more.
The slider exists for research and debugging. Leave it at the value LM Studio reads from the GGUF metadata, which matches the trained value. The screenshot shows 8 because the loaded model trained with 8 active experts.
Number of layers for which to force MoE experts to CPU (Experimental)
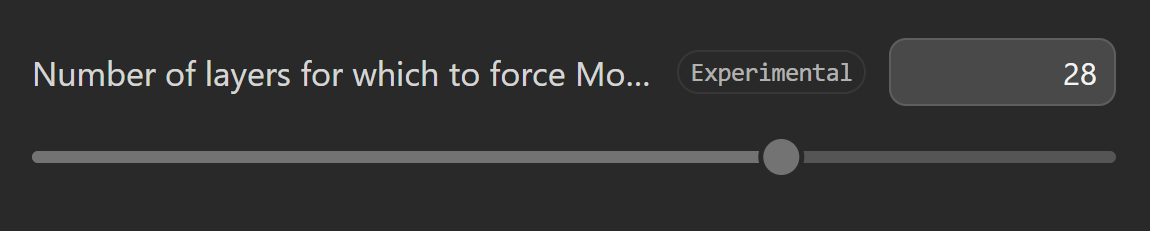
This is the --n-cpu-moe lever, and it’s the difference between “this 70B-class MoE runs on my machine” and “it doesn’t load.” Conceptually: MoE models are mostly expert weights — often 80% or more of total parameters live in the experts. At any given token, only a small fraction of experts are active. Forcing the expert tensors of the first N layers onto CPU memory (while keeping attention and shared weights on GPU) lets you run a much larger MoE than fits in VRAM, at the cost of a CPU↔GPU transfer for each active-expert lookup.
The direction matters and is easy to get backwards reading the label: higher slider value = more layers’ experts pushed to CPU = larger model fits, but slower tokens. The screenshot shows 28; that’s saying “the first 28 layers’ experts live in RAM.”
When you’d raise this:
- A MoE model that won’t load otherwise. Start at the slider’s auto-detected value (LM Studio usually picks one that lets the model fit), then raise only if you OOM.
- A MoE model that loaded but left no VRAM for context. Pushing more expert layers to CPU frees VRAM for KV cache.
When you’d lower this:
- You have VRAM headroom and want maximum tokens/sec. Lower until OOM, then back up one.
RoPE scaling: when “Auto” is wrong
Rotary Position Embedding (RoPE) is how modern transformers encode token positions. The two settings here — Frequency Base and Frequency Scale — control the rotation parameters. Auto reads the trained values from the model’s GGUF metadata and is right by default. There’s exactly one reason to override: extending context past the model’s trained window.
The mechanism: position embeddings were trained at a specific Base (commonly 10,000 for older models, 500K–1M for long-context-trained models) and Scale (commonly 1.0). Inferring at a context length the model never saw during training works surprisingly well if you adjust the RoPE parameters to extrapolate the position signal correctly — but only if. Without adjustment, position info beyond trained context collapses and the model degenerates.
Two adjustment strategies in practice:
- Linear scaling. Set Frequency Scale > 1.0 (e.g., 2.0 for 2x trained context). Simple, mediocre quality past the original window.
- YaRN-style frequency interpolation. Raise Frequency Base (e.g., from 10,000 to 1M). Better quality, more standard in 2026.
The right values depend on the model. A Llama 3.1 8B trained at 128K can run at 256K with a careful YaRN adjustment, but the exact Base/Scale comes from a paper or a community benchmark, not from guessing.
The most common load-screen mistake: setting RoPE manually on a model that doesn’t need extension. If the model already advertises the context length you want, Auto is right. Always. Manual RoPE on a model running within its trained window produces measurably worse output. The common pattern: people set these “just to be sure” and then wonder why generation quality dropped.
The rule: leave both at Auto unless you’re explicitly running past trained context, in which case look up the right Base/Scale for that specific model. Don’t experiment.
Determinism: the Seed switch
The PRNG seed for the sampler. Default: random. Toggle on and set a fixed value, and the sampler becomes deterministic — same context plus same seed equals same generation, token for token.
Two things to know:
-
Reproducibility is conditional on identical context. Any change in the prompt, the system message, tool definitions, conversation history, or even a timestamp in the prompt will produce a completely different output. Fixed seed gives you reproducibility within a controlled setup, not across casual chats.
-
This is the right tool for eval runs and bug repros. It’s the wrong tool for “make my chats less random.” If your model is too random for the use case, lower the temperature; if it’s too repetitive, raise it. Seed controls which random output you get, not how random the outputs are.
Leave on Random for everyday use. Switch to fixed only when reproducibility matters more than novelty.
How these settings fight each other
Now that we’ve seen every knob in isolation, the interactions. Most of the real damage from misconfiguration happens here — not from any single setting being wrong, but from two settings combining badly.
The memory triangle: Context Length ↔ KV cache size ↔ VRAM budget. The dominant interaction on a dGPU. Every doubling of context length roughly doubles KV cache, which competes with model weights for VRAM. Push context too high and you’ve either OOM’d at load or starved GPU Offload of layers. The cheap fix isn’t always more VRAM; it’s quantizing K cache (Q8_0 first, Q4_0 only when desperate) or shrinking context to what the workload actually needs.
The offload chain: GPU Offload ↔ Offload KV Cache to GPU ↔ KV quantization. All three control how much stuff lives on the GPU. They sit in a cascade — cheap levers first, expensive ones last. Pull them out of order and you pay more performance than you needed to.
Flash Attention is the gate to quantized KV cache. Worth repeating because people forget. K and V quantization only work with Flash Attention on. The dropdowns light up when FA is enabled and become decorative when it’s off. If you’ve set K to Q8_0 and aren’t seeing the expected VRAM savings, check FA first.
Model lifecycle gotcha: mmap() ↔ Keep Model in Memory. They don’t combine the way the labels suggest. mmap on + Keep-in-Memory on still allows the OS to evict mapped pages under pressure — you’ll see generation stalls. To actually pin the model in RAM, turn mmap off and Keep-in-Memory on. On tight-RAM systems this is the setting that fixes mysterious mid-conversation pauses.
MoE memory math: Number of Experts ↔ Force MoE on CPU. These look like they should interact (more active experts × more CPU offload = more PCIe traffic). In practice the first slider should never move from its trained value, so the only real lever is CPU offload. The interaction collapses to a single dial.
Context extension: RoPE scaling ↔ Context Length. RoPE Base/Scale only matter when Context Length exceeds the model’s trained window. Below that, Auto is always right. Above it, you need both RoPE settings tuned correctly — or quality collapses regardless of how much VRAM you’ve thrown at the cache.
Pitfalls
Concrete bad outcomes paired with the setting combinations that cause them. These are the failure modes that come up most often.
OOM mid-generation
- Symptom
- Load works because nothing’s allocated yet. First long prompt prefills, KV cache balloons, allocator fails.
- Cause
- Context Length at model max, Flash Attention off (so no KV quant), GPU Offload at max.
- Fix
- Lower Context Length first. If you actually need long context, turn FA on and quantize K to Q8_0.
Periodic 200–800ms generation stalls
- Symptom
- Generation runs fine for stretches, then halts for several hundred milliseconds, then resumes.
- Cause
- Tight-RAM system with
mmapon and Keep-in-Memory on. Pages get evicted under pressure (Chrome opens a tab, a build kicks off), then refault on next access. - Fix
- Turn
mmapoff and keep Keep-in-Memory on — that pins the bytes.
Mysteriously degraded quality after a fresh install
- Symptom
- Output quality drops noticeably with no obvious cause. Often discovered well after the change.
- Cause
- Someone “tuned” RoPE Frequency Base and Scale on a model that runs comfortably within its trained context. The values look reasonable but aren’t what the model trained on, so position embeddings drift.
- Fix
- Set both RoPE settings back to Auto.
70B MoE won't load even though it should fit
- Symptom
- Model OOMs at startup despite VRAM looking sufficient on paper.
- Cause
- Force MoE on CPU left at 0; the model needs partial expert offload to fit. LM Studio’s auto-detect for this slider has been hit-or-miss in 2026.
- Fix
- Raise the slider one layer at a time until the model loads, then leave it there.
Tokens/sec at half what it should be
- Symptom
- Throughput drops to ~50% of expected after some other config change.
- Cause
- Offload KV Cache to GPU got turned off — usually while debugging an OOM. Now every token pays a PCIe round trip.
- Fix
- Turn Offload KV Cache to GPU back on. If VRAM is the underlying issue, quantize the cache instead.
V cache Q4 broke JSON output
- Symptom
- Prose looks fine but structured output starts getting malformed — missing commas, broken brackets, off-by-one structure.
- Cause
- V Cache Quantization was enabled at Q4_0 to save VRAM. V errors hit output values directly.
- Fix
- Turn V quantization off, or move it to Q8_0 if VRAM is genuinely tight. K can stay quantized.
Too many threads, slower generation
- Symptom
- Higher thread count, lower throughput. The “more cores = faster” instinct backfires.
- Cause
- CPU Thread Pool set to total logical threads (hyperthreaded). Scheduling overhead piles up.
- Fix
- Back to physical cores minus one or two. On hybrid CPUs (Intel P+E, Apple Silicon), P-core count only.
If you skip everything above
The five settings to touch on first model load, in order. Everything else: leave default.
- Flash Attention: on. Always. It’s the gate to everything else useful in this panel.
- Context Length: 16K. Not the model max. Raise later if a specific workload needs it.
- K Cache Quantization: Q8_0. Near-free 2x cache savings, no quality cost.
- GPU Offload: max (let auto-detect pick). Only touch if auto picks below max — that’s the model telling you to shrink context or quantize cache.
- mmap() and Keep Model in Memory: both on if RAM is comfortable; mmap off, Keep on if RAM is tight.
Then load a model and send a real prompt — not “hello world,” but something representative of your actual workload. Watch the tokens/sec, watch VRAM in nvidia-smi or Activity Monitor, feel the generation cadence. If everything looks right, you’re done. If something’s off, the rest of this article tells you which knob to turn.
The Load screen looks intimidating because it surfaces every llama.cpp option that anyone has ever cared about. In practice you’ll touch five of them on day one, three of them ever again, and forget the rest exist. That’s the right relationship to have with a tool like this.