Pingy
Find out why your network drops.
A Windows desktop app that pings the servers you choose — your router, your NAS, public DNS — every second, charts every response live, and catches intermittent network dropouts in the act, with history that survives reboots.
The problem
My PC kept losing connection to the router and other machines on the LAN — for a few seconds, at random, gone again before any diagnostic tool was open. Intermittent failures are the worst kind: by the time you look, everything works.
The fix
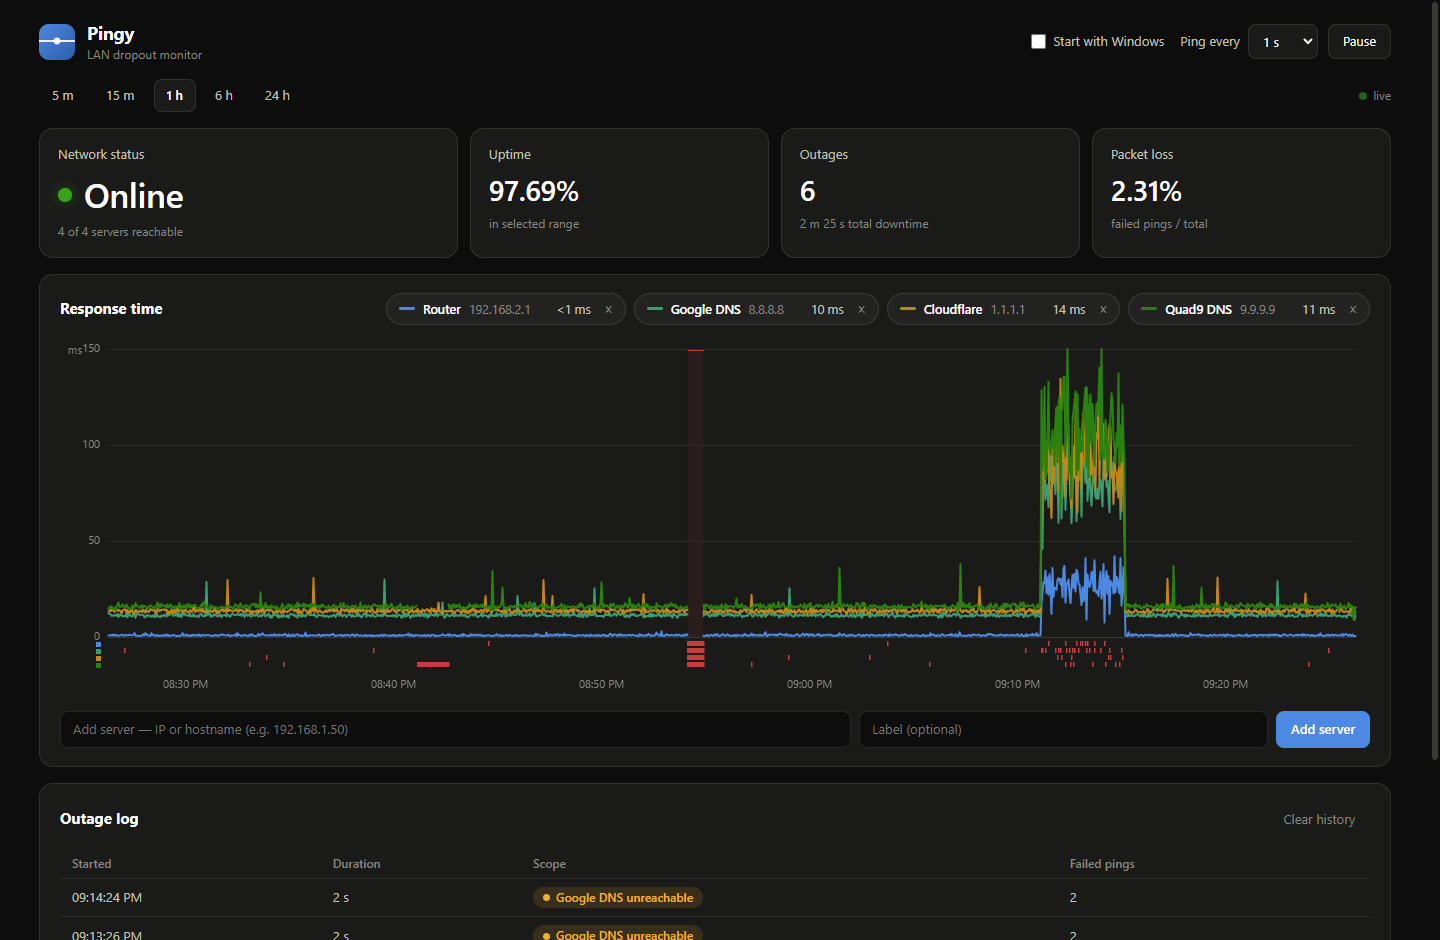
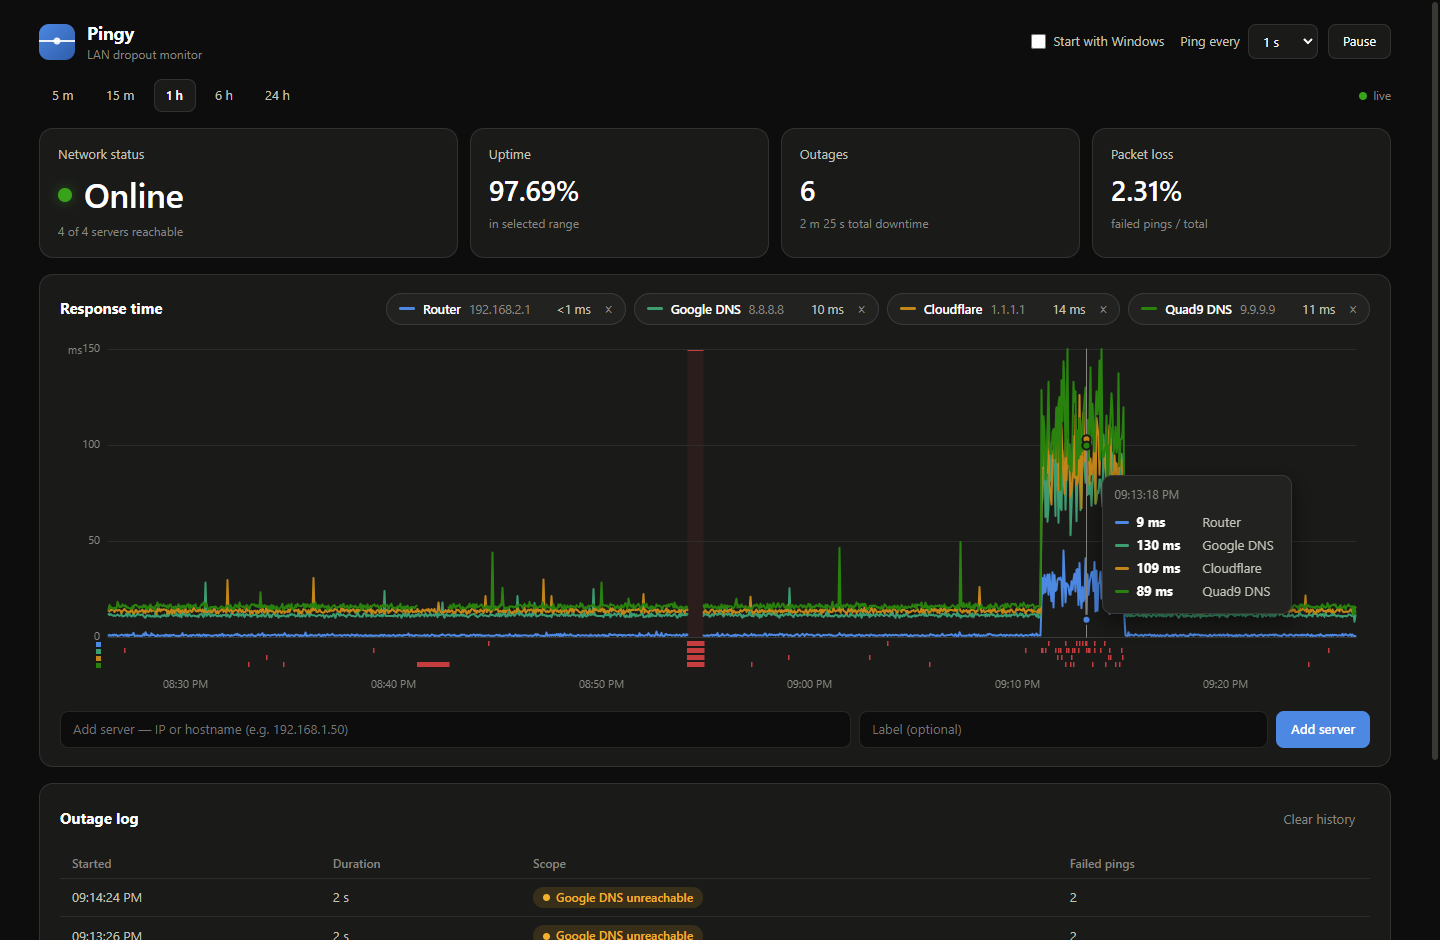
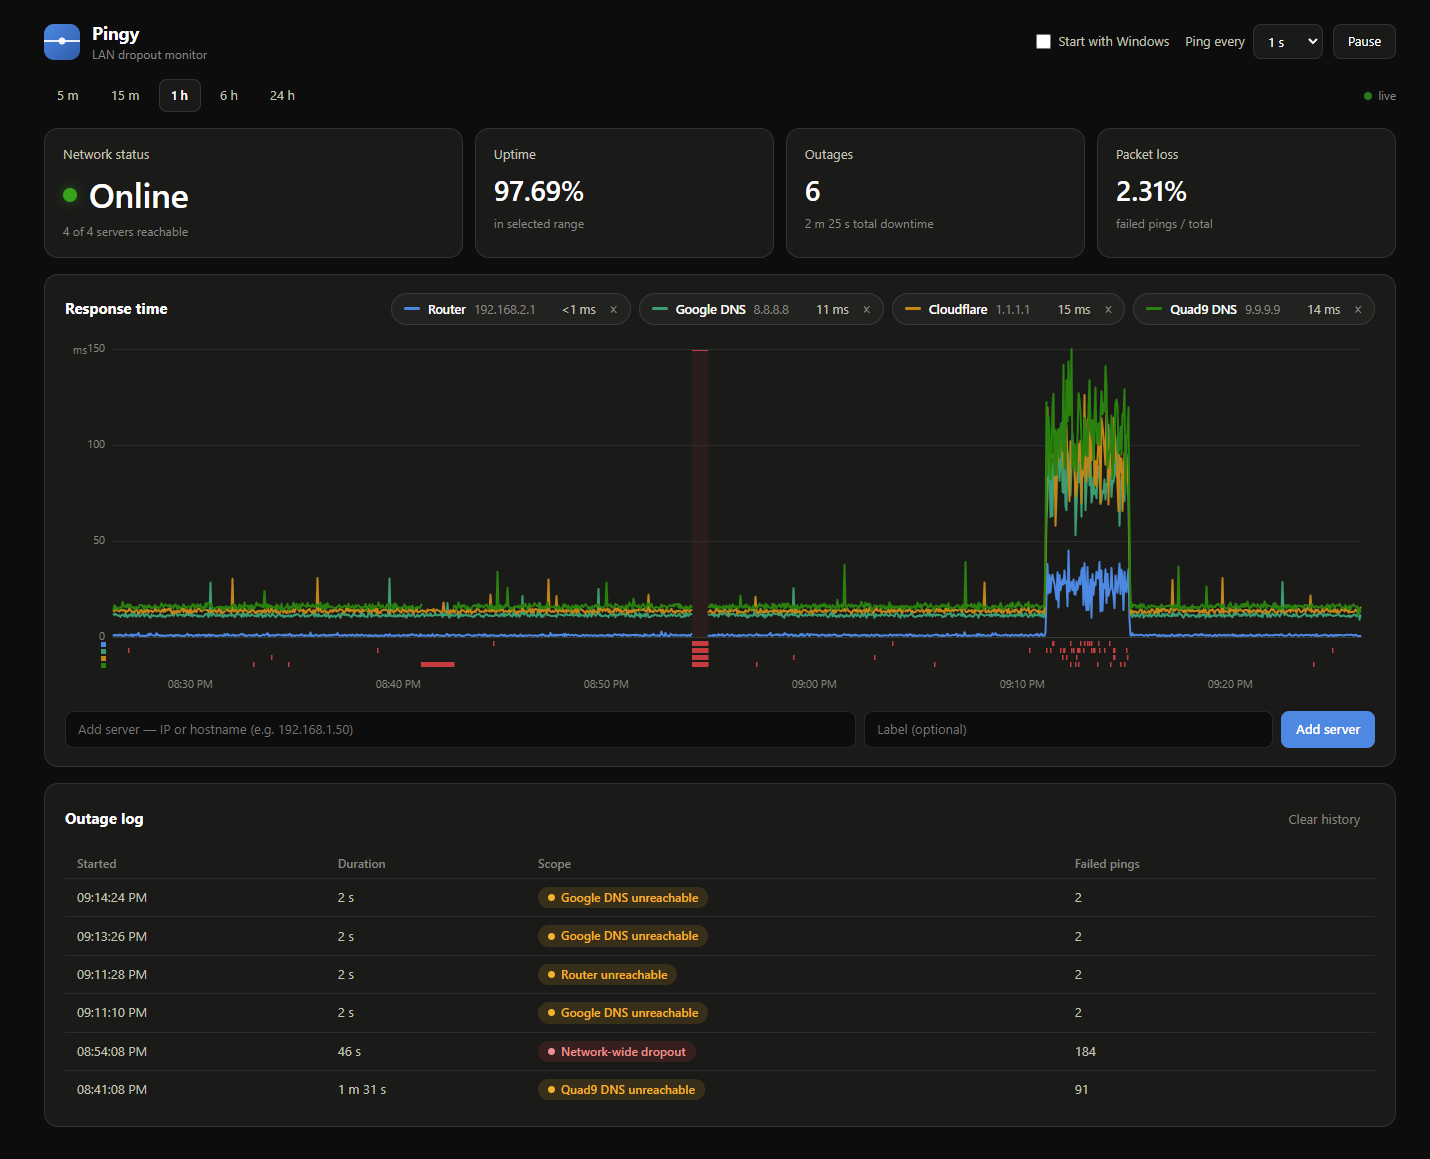
A monitor that's always looking. If only the router line dies, the problem is inside the LAN; if every line dies at once, it's a network-wide dropout — flagged as a red band on the chart and a timestamped entry in the outage log. When it finally happens at 3 AM, the chart already has it.
Features
Live latency chart
One line per server, a crosshair tooltip with every server's response time at any instant, and per-server packet-loss lanes.
Dropout classification
Distinguishes "one server is down" from "the whole network dropped" — the question that actually matters on a flaky LAN.
Outage log
Start time, duration, scope, failed-ping count, and a live "ongoing" badge for the outage happening right now.
History that survives reboots
Append-only JSONL on disk, 30-day retention, the last 24 hours reloaded on startup.
Router auto-detection
Monitors your default gateway from first launch — the diagnostic that separates LAN problems from ISP problems.
Tray mode
The tray icon is a status light (green / amber / red); monitoring continues with the window closed.
Starts with Windows
Launches silently into the tray at sign-in, so monitoring begins the moment the machine does.
Configurable
Up to 8 servers, 0.5 s–30 s intervals, 5 min–24 h chart views.
In action
How it's built
Strict Electron security posture
Context isolation, no node integration in the renderer, a CSP, and all IPC through a typed preload bridge.
Zero runtime dependencies
The chart is a hand-rolled canvas renderer with per-pixel min/max downsampling — 24 hours of 1-second samples across multiple servers renders smoothly. No chart library, no ORM, no framework.
Real ICMP, parsed defensively
Uses Windows ping.exe and distinguishes timeouts from "destination unreachable" replies that still exit 0.
Crash-tolerant persistence
Append-only JSONL, one file per day, batched writes, corrupt-line tolerant — survives power loss mid-write.
Outage detection that understands sleep
Separates consecutive-failure runs from monitoring gaps (sleep/reboot), then classifies events as host-scoped or network-wide by cross-host overlap. Time when the machine was off renders as a neutral gap, never a fake outage.
Colorblind-safe palette
Categorical series colors validated programmatically (CVD ΔE checks) against the dark surface; status colors reserved for status.
Runtime-generated tray icons
Drawn from raw BGRA buffers — no image assets.
One-click installer
Packaged with electron-builder into a per-user NSIS installer; the app manages its own "start with Windows" login item.